While renewable energy potential is often the starting point of Power-to-X (PtX) discussions, access to sustainable carbon is equally decisive for PtX projects aimed at producing synthetic fuels or chemicals. Yet however critical it may be, securing carbon supply can prove to be a demanding endeavour. Its competitiveness hinges on scalability, quality, long-term sustainability and, crucially, source type.
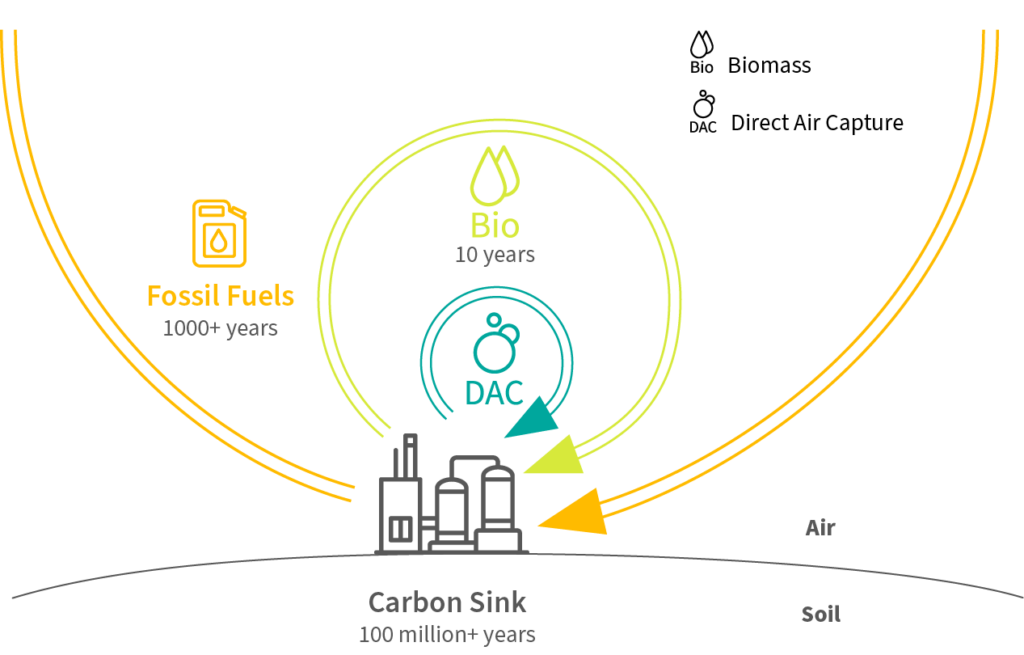
For now, considering Direct Air Capture (DAC) is still too expensive, three carbon pathways represent the most viable feedstock options for PtX development. Two are available in the form of carbon dioxide – industrial and biogenic sources – while the third consists of decentralised biogenic residues.
Industrial sources stand out due to their immediate availability and scale, making them attractive for short-term deployment. However, over the long term, ensuring the sustainability of PtX projects requires a gradual shift towards non-fossil carbon within a closed carbon cycle. This underlines the need to phase in biogenic point sources and progressively integrate decentralised biogenic residues into PtX production.
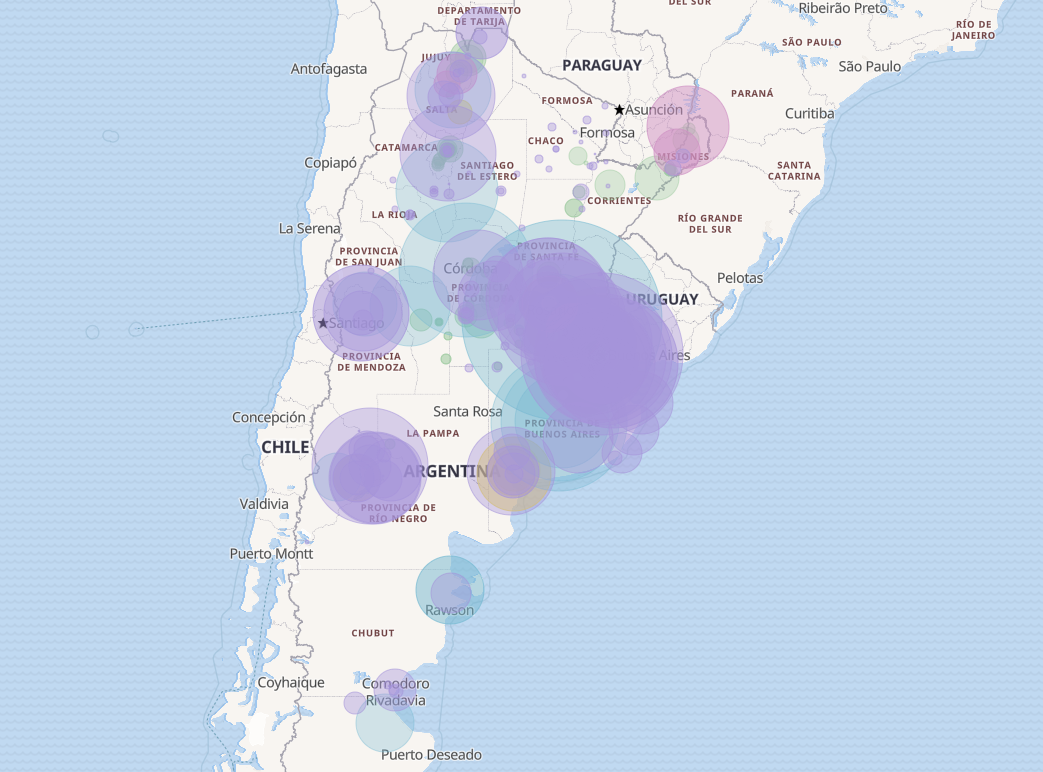
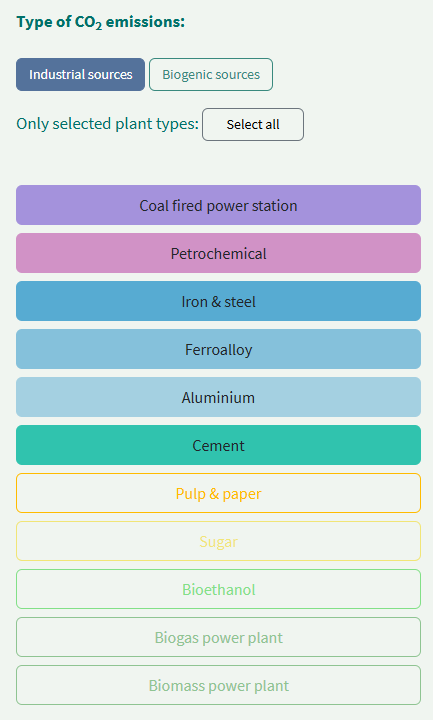
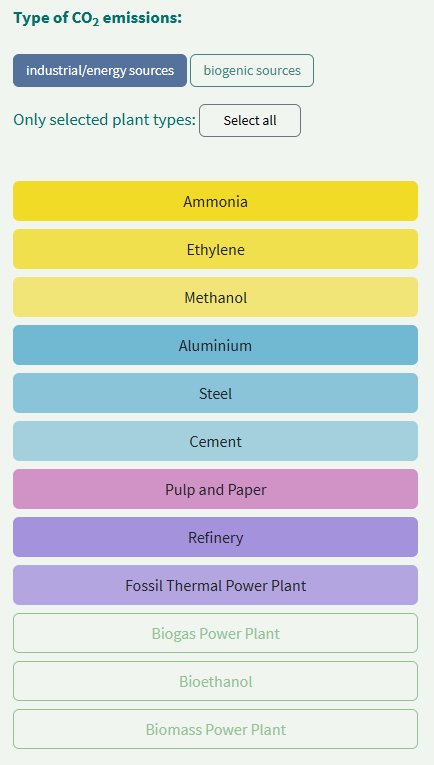
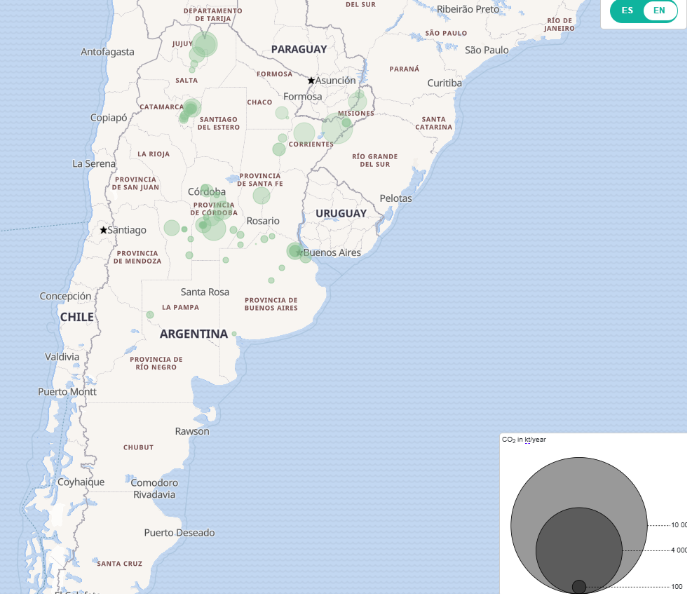
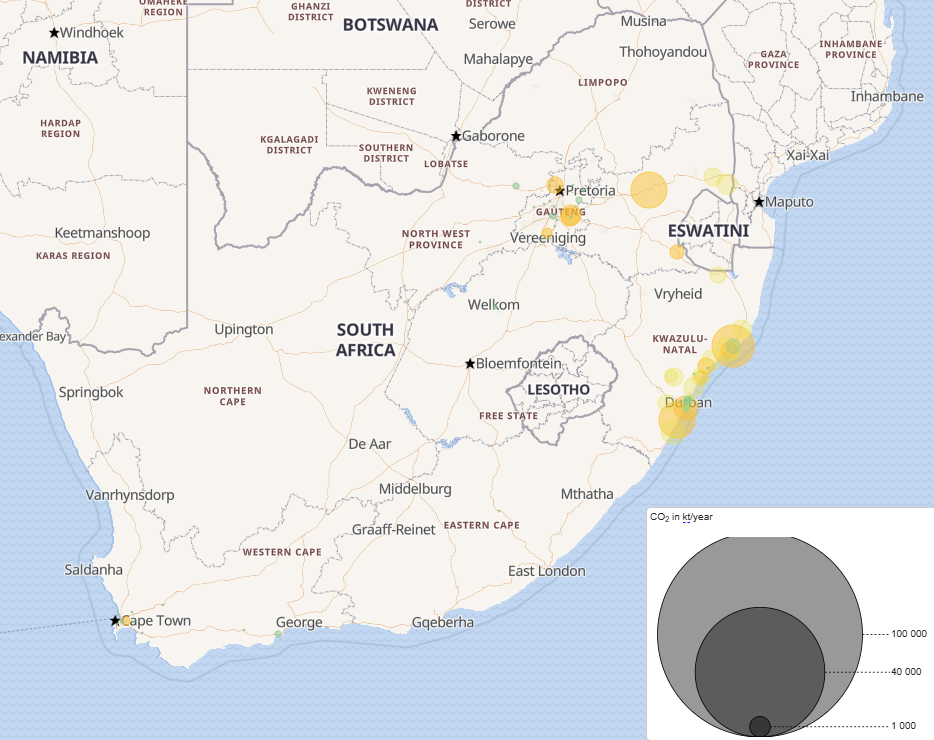
To support PtX project developers in optimising the use of carbon sources, the PtX Hub, together with its partners, has developed two maps displaying carbon dioxide point sources across Argentina and South Africa. The maps provide a visual overview of geographical distribution, type and relative scale. Variations in colour and size illustrate differences in category and emission volume. The sources are categorised according to national specificities, and each category can be selected to adjust the visual representation of the map with the corresponding lists for South Africa (left) and Argentina (right) highlighting industrial sources.
As decentralised biogenic residues could not be fully captured visually, a non-exhaustive list summarising their availability and characteristics has been added.
Towards the usage of biogenic carbon for PtX production
The central feature of the maps is a clear identification of biogenic sources, the most sustainable option for PtX development. This includes emissions from bioethanol production, biogas, biomass-based power generation, and other bio-based industrial processes.
From a spatial perspective, a clear difference emerges between the two countries. In Argentina, biogenic emissions are generally dispersed across northern and central provinces such as Córdoba, Buenos Aires, Corrientes, Tucumán, Salta or Santa Fe.
In South Africa, by contrast, biogenic emissions show up in a more clustered configuration. While several provinces – including Gauteng, the border region with Eswatini and the Western Cape – host notable biogenic sources, KwaZulu-Natal stands out for its especially high concentration of diverse biogenic carbon sources, from pulp and paper to biomass-based power generation.
https://ptx-hub.org/carbon-sources-map-south-africa/ 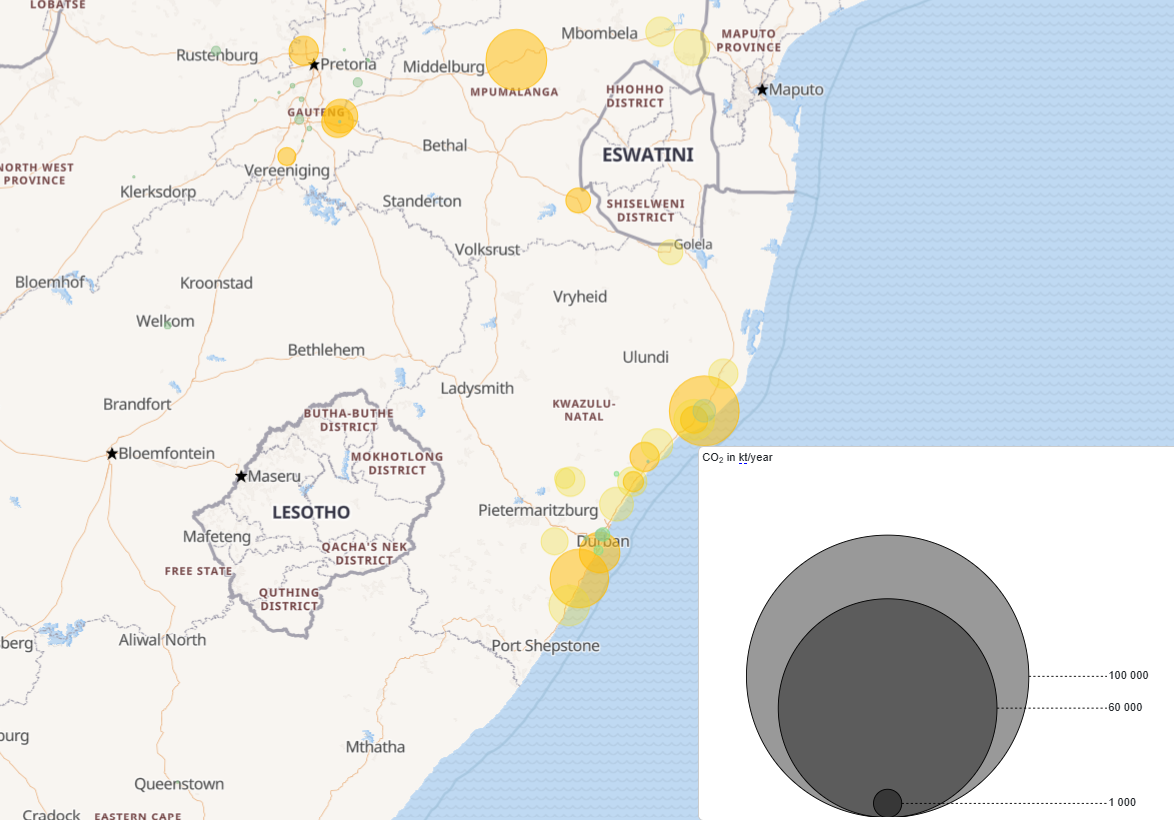
https://ptx-hub.org/carbon-sources-map-south-africa/
Beyond geography, however, sectoral composition plays a decisive role – particularly in South Africa. The country’s higher overall volume of biogenic emissions is largely driven by two industries: pulp and paper and sugar processing (in yellow). When they are excluded, the remaining sources (in green) become considerably smaller than in Argentina.
Statistics for a comparative overview of carbon emissions
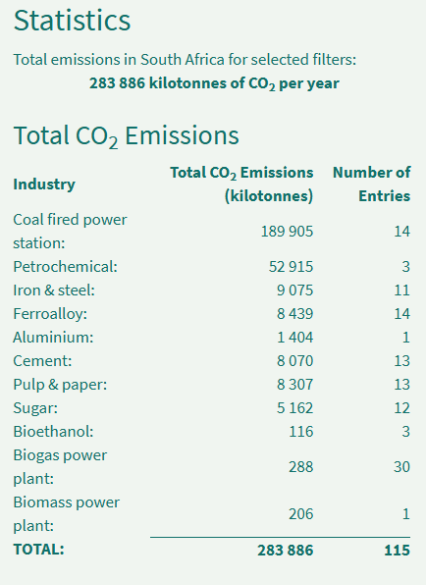
Despite the need to foster the gradual integration of biogenic sources into PtX pathways, the two maps also provide information on industrial point sources, which account for a significant share of carbon emissions in South Africa and Argentina.
This predominance is further reflected in the emissions statistics displayed next to the maps (below). These statistics present total carbon dioxide emissions alongside the number of entries for each industry type. While South Africa records the highest overall emissions, Argentina exhibits a greater number of entries.
https://ptx-hub.org/carbon-sources-map-south-africa/ 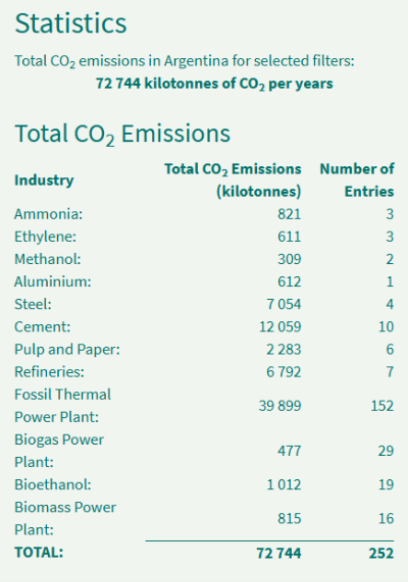
https://ptx-hub.org/carbon-sources-map-argentina/
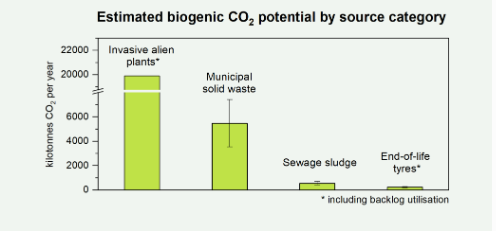
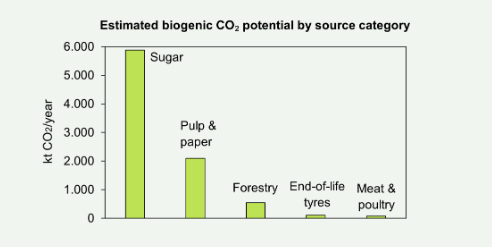
Additional data on decentralised biogenic residues potential
Decentralised biogenic residues add a further dimension to the spatial configuration of carbon availability. By definition, these resources are territorially dispersed and embedded in local ecosystems, rather than concentrated in large industrial facilities. This dispersion may complicate carbon capture logistics compared to concentrated point sources, which can be located closer to PtX production plants and therefore enable more economically viable utilisation.
For a more detailed assessment, the section on biogenic residues availability provides a regional breakdown of these decentralised resources and their estimated carbon potential. The summary of biogenic residues sheds light on sources differences for South Africa (left) and Argentina (right).
What PtX developers can learn from these maps
Taken together, the carbon dioxide maps underscore both similarities and distinct differences in the availability of carbon feedstock for PtX in South Africa and Argentina. The latter country shows a more fragmented distribution of biogenic and industrial emission sources, while South Africa displays more spatially clustered emissions. These patterns suggest different logistical and infrastructural points for each country.
Yet this structural pattern does not eliminate regional variation. Carbon availability can differ considerably between regions within the same country – especially when it comes to decentralised biogenic residues. An effective planning approach therefore requires a deep analysis of spatial details, drawing on carbon sources maps and complementary analytical tools.
The CO2 sources map for South Africa was developed with DECHEMA and the CO2 sources map for Argentina was developed with Centro de Estudios de la Actividad Regulatoria Energetica (CEARE), Fundación Torcuato di Tella, and DECHEMA as well.
Veronica Chorkulak and Johannes Arndt contributed to this article.